Watch and Learn
Watch our videos to understand RichMonks’ Elements, which help you trade better in India’s Stock Futures and Options market

A very big title of the Video in big words
A very big title of the Video in big words
A very big title of the Video in big words
Watch the videos to get indepth knowledge about RichMonks Proprietory tools.
Your trading decisions become lot more relaxed and rewarding.
The Elements of RichMonks
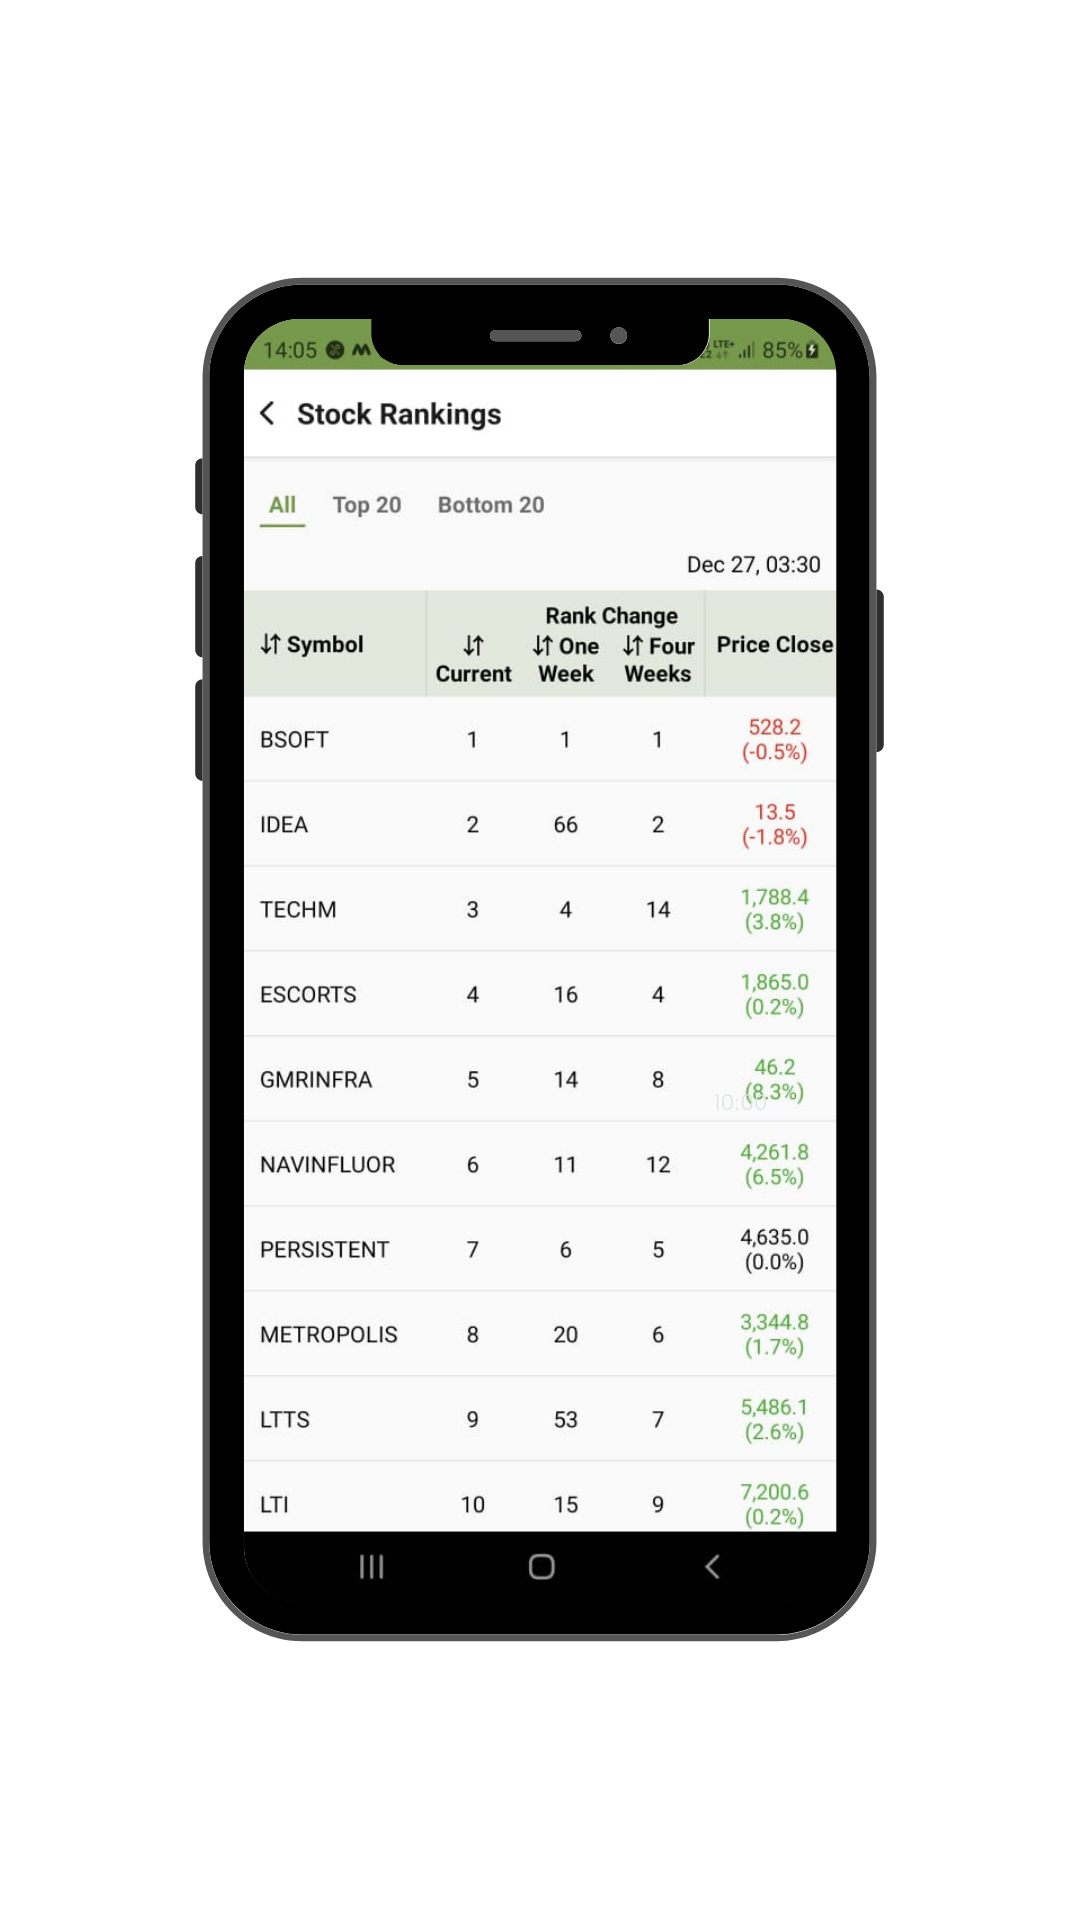
RichMonks’ Ranks
RichMonks ranks all the FNO stocks on a daily basis, based on three parameters – consistency, momentum and performance. Before making a trading decision, it would always be helpful to check out the rank of the stock. Higher rank means higher strength.
If you are an eternal bull, we would recommend RichMonks’ Top 20 Ranks for your long trades. These stocks as a group have consistently over-performed the market. Another point, they have lower probability of hitting the stop loss, a very important consideration from a trader’s point of view. Those who remain in Top 20 Ranks for longer periods hit the jackpot once in a while. For example, between 26th April and 7th May, Top 20 Ranked stocks earned profit of around Rs. 35 lacs (20 lots Long), which means return of over 30% on the margin invested, just in 15 days!
RichMonks Score
While judging your trades, you have actively looked at highs / lows, moving averages, point to point performance, Open Interest, Implied Volatility, Options prices, etc. What if somebody encapsulates all these in the form of a composite SCORE. That is what RichMonks’ Scorecard does for you. Score of 55 and above signifies strength, score of 45 and below signifies weakness.
Green, Blue, Red (GBR)
We take the score as the base, and add a few proprietary filters (Call Put Velocity, Momentum Ratio etc.). Post this exercise, each stock gets a colour, Green, Blue or Red. Green means the stock is fit for a long trade, while Red is good for shorting, of course with a stop loss.

Call / Put Velocity
RichMonks has developed an elaborate methodology to calculate Call Velocity and Put velocity for every stock. Call Velocity of greater than 1.1 means the stock has gained strength while Put velocity of greater than 1.1 means the stock has become weaker. The Call Put Velocity Table is boon for

RichMonks Senti-meter
RichMonks Fear and Greed Index is an extremely useful tool for a tactical view on the market. Back testing results show us that the market tends to fall after RM F&G Index reaches a score of 80 plus (Extreme Greed level). Similarly Score of less than 20 signifies Extreme Fear. We expect a bounce in the market within a day or two after RM F&G Index reaches this level.

Profit Per Lot
Profit Per Lot is a simple but unique concept for understanding the pulse of the market. On 30th April 2021, Nifty was down 241 points (1.62%), while Profit (Loss) Per Lot for FNO Market was merely -0.27%. This suggested that while the Index was under tremendous pressure, the broader market was absolutely normal. Next day, the market recovered smartly.

Trigger point
Trigger point is calculated for every instrument, futures or options. This serves as a reference point for judging the short term strength or weakness of the instrument. If the price crosses the trigger point, it is a sign of strength and vice versa.
